The Go Blog
More powerful Go execution traces
The runtime/trace package contains a powerful tool for understanding and
troubleshooting Go programs.
The functionality within allows one to produce a trace of each goroutine’s execution over some
time period.
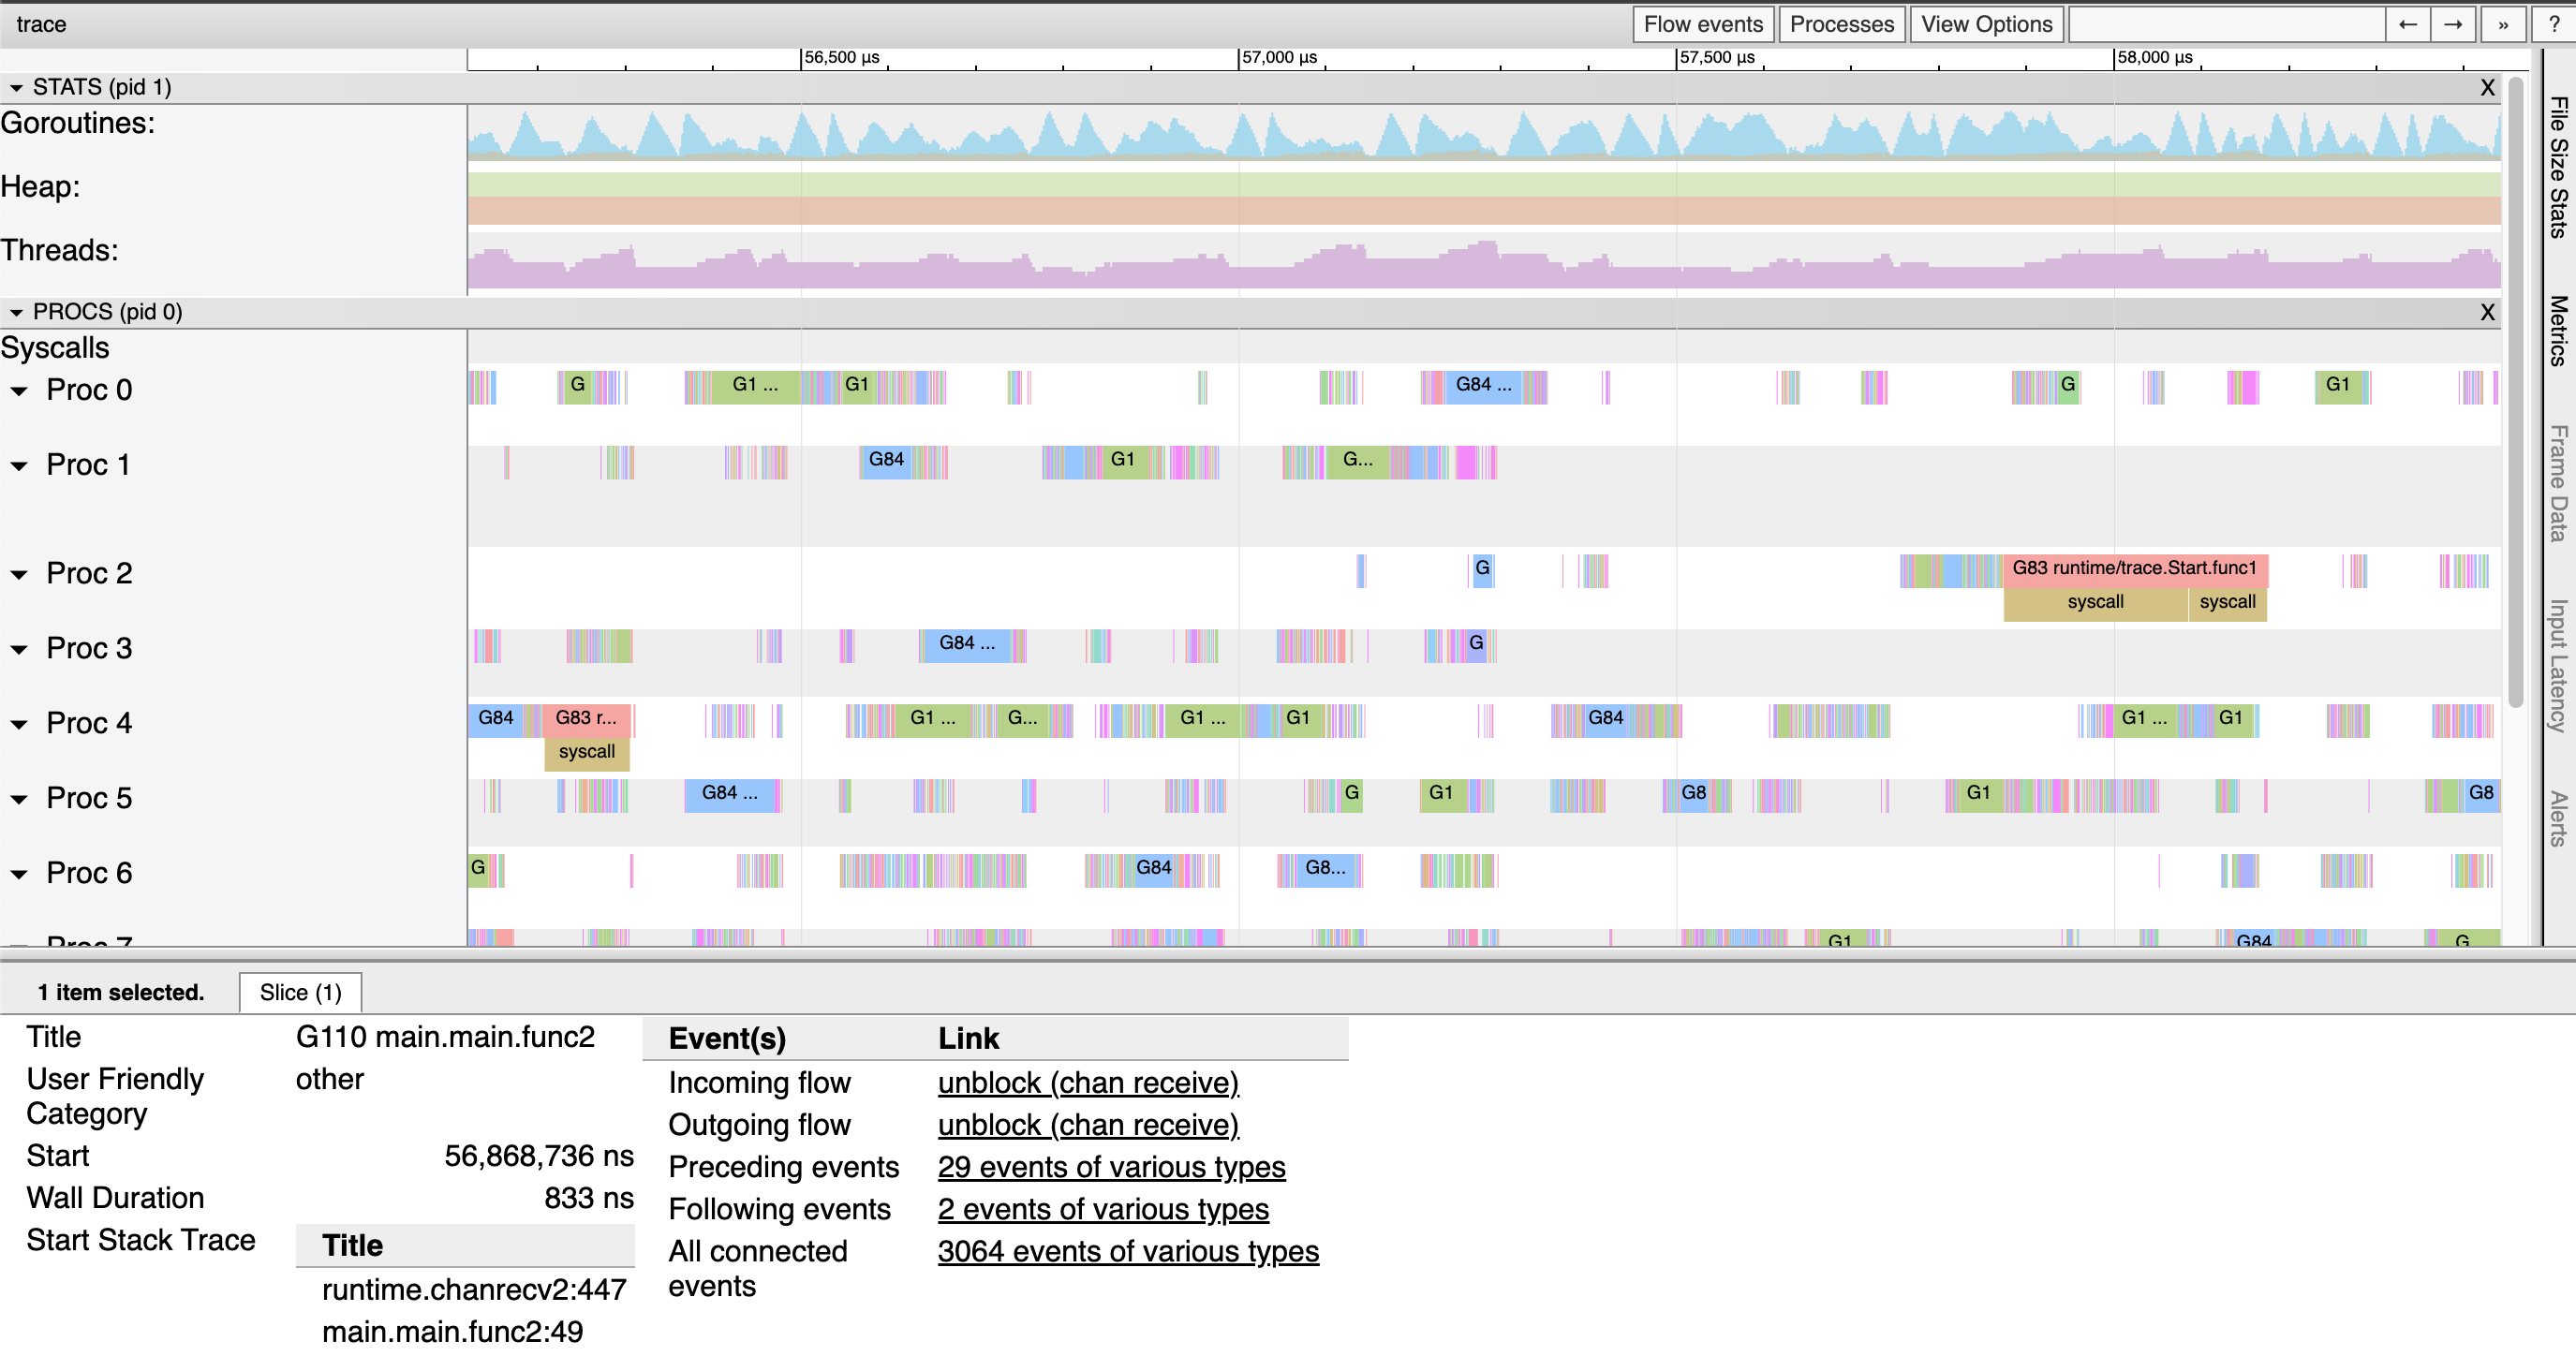
With the go tool trace command (or the excellent open source
gotraceui tool), one may then visualize and explore the data within these
traces.
The magic of a trace is that it can easily reveal things about a program that are hard to see in other ways. For example, a concurrency bottleneck where lots of goroutines block on the same channel might be quite difficult to see in a CPU profile, because there’s no execution to sample. But in an execution trace, the lack of execution will show up with amazing clarity, and the stack traces of blocked goroutines will quickly point at the culprit.
Go developers are even able to instrument their own programs with tasks, regions, and logs that they can use to correlate their higher-level concerns with lower-level execution details.
Issues
Unfortunately, the wealth of information in execution traces can often be out of reach. Four big issues with traces have historically gotten in the way.
- Traces had high overheads.
- Traces didn’t scale well, and could become too big to analyze.
- It was often unclear when to start tracing to capture a specific bad behavior.
- Only the most adventurous gophers could programmatically analyze traces, given the lack of a public package for parsing and interpreting execution traces.
If you’ve used traces in the last few years, you’ve likely been frustrated by one or more of these problems. But we’re excited to share that over the last two Go releases we’ve made big progress in all four of these areas.
Low-overhead tracing
Prior to Go 1.21, the run-time overhead of tracing was somewhere between 10–20% CPU for many applications, which limits tracing to situational usage, rather than continuous usage like CPU profiling. It turned out that much of the cost of tracing came down to tracebacks. Many events produced by the runtime have stack traces attached, which are invaluable to actually identifying what goroutines were doing at key moments in their execution.
Thanks to work by Felix Geisendörfer and Nick Ripley on optimizing the efficiency of tracebacks, the run-time CPU overhead of execution traces has been cut dramatically, down to 1–2% for many applications. You can read more about the work done here in Felix’s great blog post on the topic.
Scalable traces
The trace format and its events were designed around relatively efficient emission, but required tooling to parse and keep around the state of the entirety of a trace. A few hundred MiB trace could require several GiB of RAM to analyze!
This issue is unfortunately fundamental to how traces are generated. To keep run-time overheads low, all events are written to the equivalent of thread-local buffers. But this means events appear out of their true order, and the burden is placed on the trace tooling to figure out what really happened.
The key insight to making traces scale while keeping overheads low was to occasionally split the trace being generated. Each split point would behave a bit like simultaneously disabling and reenabling tracing in one go. All the trace data so far would represent a complete and self-contained trace, while the new trace data would seamlessly pick up from where it left off.
As you might imagine, fixing this required rethinking and rewriting a lot of the foundation of
the trace implementation in the runtime.
We’re happy to say that the work landed in Go 1.22 and is now generally available.
A lot of nice improvements came with the rewrite, including some
improvements to the go tool trace command as well.
The gritty details are all in the design
document,
if you’re curious.
(Note: go tool trace still loads the full trace into memory, but removing this
limitation for traces produced by Go 1.22+ programs is now feasible.)
Flight recording
Suppose you work on a web service and an RPC took a very long time. You couldn’t start tracing at the point you knew the RPC was already taking a while, because the root cause of the slow request already happened and wasn’t recorded.
There’s a technique that can help with this called flight recording, which you may already be familiar with from other programming environments. The insight with flight recording is to have tracing on continuously and always keep the most recent trace data around, just in case. Then, once something interesting happens, the program can just write out whatever it has!
Before traces could be split, this was pretty much a non-starter. But because continuous tracing is now viable thanks to low overheads, and the fact that the runtime can now split traces any time it needs, it turns out it was straightforward to implement flight recording.
As a result, we’re happy to announce a flight recorder experiment, available in the golang.org/x/exp/trace package.
Please try it out! Below is an example that sets up flight recording to capture a long HTTP request to get you started.
    // Set up the flight recorder.
    fr := trace.NewFlightRecorder()
    fr.Start()

    // Set up and run an HTTP server.
    var once sync.Once
    http.HandleFunc("/my-endpoint", func(w http.ResponseWriter, r *http.Request) {
        start := time.Now()

        // Do the work...
        doWork(w, r)

        // We saw a long request. Take a snapshot!
        if time.Since(start) > 300*time.Millisecond {
            // Do it only once for simplicity, but you can take more than one.
            once.Do(func() {
                // Grab the snapshot.
                var b bytes.Buffer
                _, err = fr.WriteTo(&b)
                if err != nil {
                    log.Print(err)
                    return
                }
                // Write it to a file.
                if err := os.WriteFile("trace.out", b.Bytes(), 0o755); err != nil {
                    log.Print(err)
                    return
                }
            })
        }
    })
    log.Fatal(http.ListenAndServe(":8080", nil))
If you have any feedback, positive or negative, please share it to the proposal issue!
Trace reader API
Along with the trace implementation rewrite came an effort to clean up the other trace internals,
like go tool trace.
This spawned an attempt to create a trace reader API that was good enough to share and that could
make traces more accessible.
Just like the flight recorder, we’re happy to announce that we also have an experimental trace reader API that we’d like to share. It’s available in the same package as the flight recorder, golang.org/x/exp/trace.
We think it’s good enough to start building things on top of, so please try it out! Below is an example that measures the proportion of goroutine block events that blocked to wait on the network.
    // Start reading from STDIN.
    r, err := trace.NewReader(os.Stdin)
    if err != nil {
        log.Fatal(err)
    }

    var blocked int
    var blockedOnNetwork int
    for {
        // Read the event.
        ev, err := r.ReadEvent()
        if err == io.EOF {
            break
        } else if err != nil {
            log.Fatal(err)
        }

        // Process it.
        if ev.Kind() == trace.EventStateTransition {
            st := ev.StateTransition()
            if st.Resource.Kind == trace.ResourceGoroutine {
                from, to := st.Goroutine()

                // Look for goroutines blocking, and count them.
                if from.Executing() && to == trace.GoWaiting {
                    blocked++
                    if strings.Contains(st.Reason, "network") {
                        blockedOnNetwork++
                    }
                }
            }
        }
    }
    // Print what we found.
    p := 100 * float64(blockedOnNetwork) / float64(blocked)
    fmt.Printf("%2.3f%% instances of goroutines blocking were to block on the network\n", p)
And just like the flight recorder, there’s a proposal issue that would be a great place to leave feedback!
We’d like to quickly call out Dominik Honnef as someone who tried it out early, provided great feedback, and has contributed support for older trace versions to the API.
Thank you!
This work was completed, in no small part, thanks to the help of the those in the diagnostics working group, started over a year ago as a collaboration between stakeholders from across the Go community, and open to the public.
We’d like to take a moment to thank those community members who have attended the diagnostic meetings regularly over the last year: Felix Geisendörfer, Nick Ripley, Rhys Hiltner, Dominik Honnef, Bryan Boreham, thepudds.
The discussions, feedback, and work you all put in have been instrumental to getting us to where we are today. Thank you!
Next article: Go Developer Survey 2024 H1 Results
Previous article: Robust generic functions on slices
Blog Index