Skip to content
New issue

Have a question about this project? Sign up for a free GitHub account to open an issue and contact its maintainers and the community.

By clicking “Sign up for GitHub”, you agree to our terms of service and privacy statement. We’ll occasionally send you account related emails.

Already on GitHub? Sign in to your account

runtime: scheduler work stealing slow for high GOMAXPROCS #28808

Open
ChrisHines opened this issue Nov 15, 2018 · 11 comments
Open

runtime: scheduler work stealing slow for high GOMAXPROCS #28808

ChrisHines opened this issue Nov 15, 2018 · 11 comments
Labels
compiler/runtime Issues related to the Go compiler and/or runtime. NeedsInvestigation Someone must examine and confirm this is a valid issue and not a duplicate of an existing one. Performance
Milestone

Comments

@ChrisHines
Copy link
Contributor

What version of Go are you using (go version)?

We don't have Go installed in the production environment. The program reports this info as part of reporting its version.

Go Version:     "go1.11"
Go Compiler:    "gc"
Go ARCH:        "amd64"
Go OS:          "linux"

Does this issue reproduce with the latest release?

Yes

What operating system and processor architecture are you using (go env)?

We don't have Go installed in the production environment. I think the following info is relevant to this issue.

$ cat /etc/redhat-release
CentOS Linux release 7.2.1511 (Core)

$ lscpu
Architecture:          x86_64
CPU op-mode(s):        32-bit, 64-bit
Byte Order:            Little Endian
CPU(s):                56
On-line CPU(s) list:   0-55
Thread(s) per core:    2
Core(s) per socket:    14
Socket(s):             2
NUMA node(s):          2
Vendor ID:             GenuineIntel
CPU family:            6
Model:                 79
Model name:            Intel(R) Xeon(R) CPU E5-2660 v4 @ 2.00GHz
Stepping:              1
CPU MHz:               1207.421
BogoMIPS:              4004.63
Virtualization:        VT-x
L1d cache:             32K
L1i cache:             32K
L2 cache:              256K
L3 cache:              35840K
NUMA node0 CPU(s):     0,2,4,6,8,10,12,14,16,18,20,22,24,26,28,30,32,34,36,38,40,42,44,46,48,50,52,54
NUMA node1 CPU(s):     1,3,5,7,9,11,13,15,17,19,21,23,25,27,29,31,33,35,37,39,41,43,45,47,49,51,53,55

What did you do?

We have an application that primarily retrieves data in large chunks from a node-local cache server via HTTP, packetizes it, and sends the packets out at a target bitrate via UDP. It does this for many concurrent streaming sessions per node. A node with the CPU shown above will serve several hundred streaming sessions at once.

The application currently starts separate goroutines for each streaming session. Each session has a goroutine responsible for outputting the UDP packets as close to the target bitrate as possible. That goroutine uses a time.Ticker to wake up periodically and transmit data. The Go execution tracer shows that each of these transmitting goroutines typically runs for about 15µs once every 2.4ms.

Until recently the application was built with Go 1.9. We found empirically that running five instances of the program on a node—each instance handling one fifth of the work—handled our work load the best. At the time we didn't understand why we had to shard the workload across multiple processes, but the empirical data was conclusive.

We built our latest release with Go 1.11 and began load testing it with the same configuration of five instances per node.

What did you expect to see?

We expected to see that the new release built with Go 1.11 performed at least as well as the previous release built with Go 1.9.

What did you see instead?

The new release built with Go 1.11 consumed significantly more CPU for the same workload compared with the previous release built with Go 1.9. We eliminated the possibility that the changes in our new release were the cause by rebuilding the previous release with Go 1.11 and observed that it also consumed significantly more CPU for the same load as the same code built with Go 1.9.

We collected CPU profile data from these three builds of the program under load and began looking for culprits. The data showed that the Go 1.11 builds were spending about 3x CPU time in runtime.findrunnable and its helpers than the Go 1.9 builds.

Looking at the commit history since Go 1.9 for that part of the runtime we identified commit "runtime: improve timers scalability on multi-CPU systems" as the only change that seemed relevant. But we were puzzled that despite the performance improvements to timer handling we saw increased CPU load rather than performance improvements for our program.

After further analysis, however, we realized that the inefficient timer implementation was the likely reason we were forced to shard the load across five processes when using Go 1.9. Since the profile data for the Go 1.11 build showed that the cumulative time spent in runtime.runqsteal was the largest contributor to the cumulative time of runtime.findrunnable we hypothesized that with the timer handling bottleneck reduced each P in the scheduler could advance to the work stealing loop instead of contending for the timer lock. Furthermore, since we were running on hardware with 56 hardware threads and had not set an explicit GOMAXPROCS the work stealing loop was rather expensive, especially if it typically found all the other run queues empty, which we confirmed by running with GODEBUG=schedtrace=1000.

With that hypothesis seeming sound we next hypothesized that running each of the five Go 1.11 processes with GOMAXPROCS=12 would be a better configuration to reduce the work stealing iterations and without under utilizing the available hardware threads. This idea also matched the conclusion of this similar issue (now closed) #16476. Load tests with five instances of a Go 1.11 build each with GOMAXPROCS=12 found a similar amount of CPU consumption as with Go 1.9 builds. This is a reasonable workaround and we are using it now.

Although there is a simple workaround, it is unsettling that the runtime scheduler does not scale well for this type of workload on high core counts. Notably, the work stealing algorithm degenerates to O(N²) due to N cores all inspecting each other's mostly empty run queues. The CPU time spent fruitlessly attempting to steal work from empty run queues contributes to overall system load and competes with the demands of other processes on the node, such as the local content cache server mentioned earlier.

The problem I've described here is almost the same as #18237, in which @aclements explained:

Given how much time you're spending in findrunnable, it sounds like you're constantly switching between having something to do and being idle. Presumably the 1500 byte frames are coming in just a little slower than you can process them, so the runtime is constantly looking for work to do, going to sleep, and then immediately being woken up for the next frame. This is the most expensive path in the scheduler (we optimize for the case where there's another goroutine ready to run, which is extremely fast) and there's an implicit assumption here that the cost of going to sleep doesn't really matter if there's nothing to do. But that's violated if new work is coming in at just the wrong rate.

I am creating a new issue because our goroutines are made runnable largely by runtime timers instead of network events. I believe that is a significant difference because although the scheduler cannot easily predict the arrival of network events, runtime timers have known expiration times.

Reproducing

Below is a small program that models the critical path of the application. The code will not run on the playground, but here is a link in case that is more convenient that the inline code below. https://play.golang.org/p/gcGT2v2mZjU

Profile data we've collected from this program shows a strong resemblance to the profile data from the bigger program we originally witnessed this issue with, at least with regard to the Go runtime functions involved.

package main

import (
	"flag"
	"log"
	"math/rand"
	"os"
	"os/signal"
	"runtime"
	"runtime/pprof"
	"runtime/trace"
	"sync"
	"time"
)

func main() {
	var (
		runTime        = flag.Duration("runtime", 10*time.Second, "Run `duration` after target go routine count is reached")
		workDur        = flag.Duration("work", 15*time.Microsecond, "CPU bound work `duration` each cycle")
		cycleDur       = flag.Duration("cycle", 2400*time.Microsecond, "Cycle `duration`")
		gCount         = flag.Int("gcount", runtime.NumCPU(), "Number of `goroutines` to use")
		gStartFreq     = flag.Int("gfreq", 1, "Number of goroutines to start each second until gcount is reached")
		cpuProfilePath = flag.String("cpuprofile", "", "Write CPU profile to `file`")
		tracePath      = flag.String("trace", "", "Write execution trace to `file`")
	)

	flag.Parse()

	sigC := make(chan os.Signal, 1)
	signal.Notify(sigC, os.Interrupt)

	var wg sync.WaitGroup
	done := make(chan struct{})
	stop := make(chan struct{})

	wg.Add(1)
	go func() {
		defer wg.Done()
		select {
		case sig := <-sigC:
			log.Print("got signal ", sig)
		case <-stop:
		}
		close(done)
	}()

	gFreq := time.Second / time.Duration(*gStartFreq)
	jitterCap := int64(gFreq / 2)

	for g := 0; g < *gCount; g++ {
		wg.Add(1)
		go func(id int) {
			defer wg.Done()
			ticker := time.NewTicker(*cycleDur)
			defer ticker.Stop()
			for {
				select {
				case <-done:
					return
				case <-ticker.C:
					workUntil(time.Now().Add(*workDur))
				}
			}
		}(g)
		log.Print("goroutine count: ", g+1)
		jitter := time.Duration(rand.Int63n(jitterCap))
		select {
		case <-done:
			g = *gCount // stop loop early
		case <-time.After(gFreq + jitter):
		}
	}

	select {
	case <-done:
	default:
		log.Print("running for ", *runTime)
		runTimer := time.NewTimer(*runTime)
		wg.Add(1)
		go func() {
			wg.Done()
			select {
			case <-runTimer.C:
				log.Print("runTimer fired")
				close(stop)
			}
		}()
	}

	if *cpuProfilePath != "" {
		f, err := os.Create(*cpuProfilePath)
		if err != nil {
			log.Fatal("could not create CPU profile: ", err)
		}
		if err := pprof.StartCPUProfile(f); err != nil {
			log.Fatal("could not start CPU profile: ", err)
		}
		log.Print("profiling")
		defer pprof.StopCPUProfile()
	}

	if *tracePath != "" {
		f, err := os.Create(*tracePath)
		if err != nil {
			log.Fatal("could not create execution trace: ", err)
			os.Exit(1)
		}
		defer f.Close()
		if err := trace.Start(f); err != nil {
			log.Fatal("could not start execution trace: ", err)
		}
		log.Print("tracing")
		defer trace.Stop()
	}

	wg.Wait()
}

func workUntil(deadline time.Time) {
	now := time.Now()
	for now.Before(deadline) {
		now = time.Now()
	}
}

Profile Data

We ran the above program in several configurations and captured profile and schedtrace data.

Go 1.9, GOMAXPROCS=56, 5 procs x 500 goroutines

schedtrace sample

SCHED 145874ms: gomaxprocs=56 idleprocs=50 threads=60 spinningthreads=1 idlethreads=50 runqueue=0 [0 0 0 0 0 0 0 0 0 0 0 0 0 0 0 0 0 0 0 0 0 0 0 0 0 0 0 0 0 0 0 0 0 0 0 0 0 0 0 0 0 0 0 0 0 0 0 0 0 0 0 0 0 0 0 0]
SCHED 146880ms: gomaxprocs=56 idleprocs=43 threads=60 spinningthreads=4 idlethreads=43 runqueue=0 [0 0 0 0 0 0 0 0 0 0 0 0 0 0 0 0 0 0 0 0 0 0 0 0 0 0 0 0 0 0 0 0 0 0 0 0 0 0 0 0 0 0 0 0 0 0 0 0 0 0 0 0 0 0 0 0]
SCHED 147886ms: gomaxprocs=56 idleprocs=49 threads=60 spinningthreads=1 idlethreads=49 runqueue=0 [0 0 0 0 0 0 0 0 0 0 0 0 0 0 0 0 0 0 0 0 0 0 0 0 0 0 0 0 0 0 0 0 0 0 0 0 0 0 0 0 0 0 0 0 0 0 0 0 0 0 0 0 0 0 0 0]
SCHED 148892ms: gomaxprocs=56 idleprocs=56 threads=60 spinningthreads=0 idlethreads=56 runqueue=0 [0 0 0 0 0 0 0 0 0 0 0 0 0 0 0 0 0 0 0 0 0 0 0 0 0 0 0 0 0 0 0 0 0 0 0 0 0 0 0 0 0 0 0 0 0 0 0 0 0 0 0 0 0 0 0 0]
SCHED 149898ms: gomaxprocs=56 idleprocs=50 threads=60 spinningthreads=1 idlethreads=50 runqueue=0 [0 0 0 0 0 0 0 0 0 0 0 0 0 0 0 0 0 0 0 0 0 0 0 0 0 0 0 0 0 0 0 0 0 0 0 0 0 0 0 0 0 0 0 0 0 0 0 0 0 0 0 0 0 0 0 0]

pprof data

File: sched-test-linux-9
Type: cpu
Time: Oct 30, 2018 at 3:26pm (EDT)
Duration: 1mins, Total samples = 4.70mins (468.80%)
Entering interactive mode (type "help" for commands, "o" for options)
(pprof) top20 -cum
Showing nodes accounting for 229.49s, 81.39% of 281.97s total
Dropped 61 nodes (cum <= 1.41s)
Showing top 20 nodes out of 43
      flat  flat%   sum%        cum   cum%
         0     0%     0%    143.03s 50.73%  runtime._System
   135.95s 48.21% 48.21%    135.95s 48.21%  runtime._ExternalCode
     0.18s 0.064% 48.28%     73.63s 26.11%  runtime.mcall
     0.06s 0.021% 48.30%     73.45s 26.05%  runtime.park_m
     0.67s  0.24% 48.54%     72.55s 25.73%  runtime.schedule
    11.32s  4.01% 52.55%     60.58s 21.48%  runtime.findrunnable
     0.97s  0.34% 52.90%     56.95s 20.20%  main.main.func2
     7.71s  2.73% 55.63%     41.98s 14.89%  main.workUntil
     9.40s  3.33% 58.96%     29.40s 10.43%  time.Now
    25.23s  8.95% 67.91%     25.23s  8.95%  runtime.futex
    11.73s  4.16% 72.07%        20s  7.09%  time.now
     3.92s  1.39% 73.46%     19.21s  6.81%  runtime.runqsteal
     0.59s  0.21% 73.67%     15.43s  5.47%  runtime.stopm
    15.06s  5.34% 79.01%     15.29s  5.42%  runtime.runqgrab
     0.11s 0.039% 79.05%     14.20s  5.04%  runtime.futexsleep
     0.92s  0.33% 79.38%     13.86s  4.92%  runtime.notesleep
     4.47s  1.59% 80.96%     12.79s  4.54%  runtime.selectgo
     0.43s  0.15% 81.12%     12.30s  4.36%  runtime.startm
     0.56s   0.2% 81.31%     11.56s  4.10%  runtime.notewakeup
     0.21s 0.074% 81.39%     11.52s  4.09%  runtime.wakep

Go 1.11, GOMAXPROCS=56, 5 procs x 500 goroutines

schedtrace sample

SCHED 144758ms: gomaxprocs=56 idleprocs=52 threads=122 spinningthreads=2 idlethreads=59 runqueue=0 [0 0 0 0 0 0 0 0 0 0 0 0 0 0 0 0 0 0 0 0 0 0 0 0 0 0 0 0 0 0 0 0 0 0 0 0 0 0 0 0 0 0 0 0 0 0 0 0 0 0 0 0 0 0 0 0]
SCHED 145764ms: gomaxprocs=56 idleprocs=46 threads=122 spinningthreads=4 idlethreads=55 runqueue=0 [0 0 0 0 0 0 0 0 0 0 0 0 0 0 0 0 0 0 0 0 0 0 0 0 0 0 0 0 0 0 0 0 0 0 0 0 0 0 0 0 0 0 0 0 0 0 0 0 0 0 0 0 0 0 0 0]
SCHED 146769ms: gomaxprocs=56 idleprocs=46 threads=122 spinningthreads=3 idlethreads=56 runqueue=0 [0 0 0 0 0 0 0 0 0 0 0 0 0 0 0 0 0 0 0 0 0 0 0 0 0 0 0 0 0 0 0 0 0 0 0 0 0 0 0 0 0 0 0 0 0 0 0 0 0 0 0 0 0 0 0 0]
SCHED 147774ms: gomaxprocs=56 idleprocs=46 threads=122 spinningthreads=2 idlethreads=55 runqueue=0 [0 0 0 0 0 0 0 0 0 0 0 0 0 0 0 0 0 0 0 0 0 0 0 0 0 0 0 0 0 0 0 0 0 0 0 0 0 0 0 0 0 0 0 0 0 0 0 0 0 0 0 0 0 0 0 0]
SCHED 148780ms: gomaxprocs=56 idleprocs=52 threads=122 spinningthreads=2 idlethreads=60 runqueue=0 [0 0 0 0 0 0 0 0 0 0 0 0 0 0 0 0 0 0 0 0 0 0 0 0 0 0 0 0 0 0 0 0 0 0 0 0 0 0 0 0 0 0 0 0 0 0 0 0 0 0 0 0 0 1 0 0]
SCHED 149785ms: gomaxprocs=56 idleprocs=46 threads=122 spinningthreads=1 idlethreads=57 runqueue=0 [0 0 0 0 0 0 0 0 0 0 0 0 0 0 0 0 0 0 0 0 0 0 0 0 0 0 0 0 0 0 0 0 0 0 0 0 0 0 0 0 0 0 0 0 0 0 0 0 0 0 0 0 0 0 0 0]

pprof data

File: sched-test-linux-11
Type: cpu
Time: Oct 30, 2018 at 3:35pm (EDT)
Duration: 1mins, Total samples = 6.43mins (641.46%)
Entering interactive mode (type "help" for commands, "o" for options)
(pprof) top20 -cum
Showing nodes accounting for 310.85s, 80.57% of 385.80s total
Dropped 61 nodes (cum <= 1.93s)
Showing top 20 nodes out of 49
      flat  flat%   sum%        cum   cum%
   160.61s 41.63% 41.63%    169.60s 43.96%  time.now
     0.83s  0.22% 41.85%    122.39s 31.72%  runtime.mcall
     0.13s 0.034% 41.88%    121.56s 31.51%  runtime.park_m
     0.64s  0.17% 42.05%    120.12s 31.14%  runtime.schedule
    19.14s  4.96% 47.01%    115.47s 29.93%  runtime.findrunnable
     1.54s   0.4% 47.41%     64.15s 16.63%  main.main.func2
    53.51s 13.87% 61.28%     53.51s 13.87%  runtime.futex
     1.47s  0.38% 61.66%     48.66s 12.61%  runtime.timerproc
    10.70s  2.77% 64.43%     47.49s 12.31%  runtime.runqsteal
     9.88s  2.56% 66.99%     44.13s 11.44%  main.workUntil
     0.14s 0.036% 67.03%     36.91s  9.57%  runtime.notetsleepg
    35.08s  9.09% 76.12%     36.79s  9.54%  runtime.runqgrab
     0.73s  0.19% 76.31%     36.66s  9.50%  runtime.futexsleep
     8.79s  2.28% 78.59%     30.07s  7.79%  time.Now
     1.12s  0.29% 78.88%     26.48s  6.86%  runtime.stopm
     0.33s 0.086% 78.96%     23.16s  6.00%  runtime.systemstack
     1.49s  0.39% 79.35%     22.39s  5.80%  runtime.notesleep
     0.39s   0.1% 79.45%     18.49s  4.79%  runtime.startm
     0.09s 0.023% 79.47%     17.68s  4.58%  runtime.futexwakeup
     4.24s  1.10% 80.57%     17.56s  4.55%  runtime.selectgo

Go 1.11, GOMAXPROCS=12, 5 procs x 500 goroutines

schedtrace sample

SCHED 145716ms: gomaxprocs=12 idleprocs=8 threads=31 spinningthreads=2 idlethreads=11 runqueue=0 [0 0 0 0 0 0 0 0 0 0 0 0]
SCHED 146721ms: gomaxprocs=12 idleprocs=8 threads=31 spinningthreads=1 idlethreads=12 runqueue=0 [0 0 0 0 0 0 0 0 0 0 0 0]
SCHED 147725ms: gomaxprocs=12 idleprocs=8 threads=31 spinningthreads=3 idlethreads=11 runqueue=0 [0 0 0 0 0 0 0 0 0 0 0 0]
SCHED 148730ms: gomaxprocs=12 idleprocs=9 threads=31 spinningthreads=0 idlethreads=12 runqueue=0 [0 0 0 0 0 0 0 0 0 0 0 0]
SCHED 149735ms: gomaxprocs=12 idleprocs=6 threads=31 spinningthreads=1 idlethreads=9 runqueue=0 [0 0 0 0 0 0 0 0 0 0 0 0]
SCHED 150740ms: gomaxprocs=12 idleprocs=2 threads=31 spinningthreads=3 idlethreads=5 runqueue=0 [0 0 0 0 0 0 0 0 0 0 0 0]

pprof data

File: sched-test-linux-11
Type: cpu
Time: Oct 30, 2018 at 3:32pm (EDT)
Duration: 1mins, Total samples = 4.49mins (447.65%)
Entering interactive mode (type "help" for commands, "o" for options)
(pprof) top20 -cum
Showing nodes accounting for 223.33s, 82.96% of 269.19s total
Dropped 61 nodes (cum <= 1.35s)
Showing top 20 nodes out of 46
      flat  flat%   sum%        cum   cum%
   152.74s 56.74% 56.74%    160.99s 59.81%  time.now
     0.82s   0.3% 57.05%     49.80s 18.50%  main.main.func2
     0.44s  0.16% 57.21%     42.75s 15.88%  runtime.mcall
     0.09s 0.033% 57.24%     42.03s 15.61%  runtime.park_m
     0.57s  0.21% 57.45%     41.32s 15.35%  runtime.schedule
    41.16s 15.29% 72.74%     41.16s 15.29%  runtime.futex
     9.33s  3.47% 76.21%     41.09s 15.26%  main.workUntil
        5s  1.86% 78.07%     36.28s 13.48%  runtime.findrunnable
     1.06s  0.39% 78.46%     33.86s 12.58%  runtime.timerproc
     0.55s   0.2% 78.67%     29.45s 10.94%  runtime.futexsleep
     7.98s  2.96% 81.63%     27.25s 10.12%  time.Now
     0.07s 0.026% 81.66%     25.42s  9.44%  runtime.notetsleepg
     0.55s   0.2% 81.86%     17.84s  6.63%  runtime.stopm
     0.72s  0.27% 82.13%     16.36s  6.08%  runtime.notesleep
     1.39s  0.52% 82.64%     15.18s  5.64%  runtime.notetsleep_internal
     0.22s 0.082% 82.73%     13.38s  4.97%  runtime.startm
     0.16s 0.059% 82.79%     12.66s  4.70%  runtime.systemstack
     0.35s  0.13% 82.92%     12.46s  4.63%  runtime.notewakeup
     0.05s 0.019% 82.93%     12.32s  4.58%  runtime.futexwakeup
     0.08s  0.03% 82.96%      8.78s  3.26%  runtime.entersyscallblock

I can test other configurations if it will help.

@agnivade agnivade added the NeedsInvestigation Someone must examine and confirm this is a valid issue and not a duplicate of an existing one. label Nov 15, 2018
@randall77
Copy link
Contributor

I suspect this falls in the general category of "Go does not play well with other loads on the system", the "other loads" in this case the other 4 instances of the Go program. This might be a dup of either #17969 or #18237.

Did you try running only one instance of the program on your host with 1.11? I'm curious whether the fixes since 1.9 mean you no longer have to run 5 separate processes.

@ChrisHines
Copy link
Contributor Author

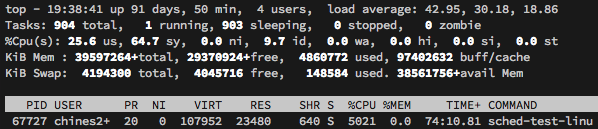
@randall77 Yes, we tried running only one instance with 1.11. It consumed all available CPU on the box and was not able to handle the equivalent load. I didn't mention that above because the data from that run was a little confusing and the initial report was already rather long. In that test the content cache server also started using a lot of CPU by the end of the test and we weren't sure if it was a valid test since the OS was limiting how many cores the Go process could actually use.

However, I also tried running the small program above with a single instance and equivalent goroutine count and it produced these results:

Go 1.11, GOMAXPROCS=56, 1 proc x 2500 goroutines

schedtrace sample

SCHED 149973ms: gomaxprocs=56 idleprocs=0 threads=140 spinningthreads=0 idlethreads=79 runqueue=54 [21 2 10 0 51 37 0 9 25 21 0 76 17 69 2 43 30 0 25 41 32 0 11 32 4 49 19 1 13 25 6 16 26 23 16 66 1 39 1 33 0 17 16 32 54 54 48 40 16 111 56 0 21 1 72 14]
SCHED 150981ms: gomaxprocs=56 idleprocs=0 threads=140 spinningthreads=0 idlethreads=79 runqueue=54 [45 50 8 21 36 5 57 26 12 26 0 33 15 7 35 2 37 5 17 35 10 37 37 6 29 2 30 30 11 43 57 54 34 27 37 65 25 34 14 7 8 16 31 0 41 6 46 50 27 22 21 29 14 30 34 1]
SCHED 151989ms: gomaxprocs=56 idleprocs=0 threads=140 spinningthreads=0 idlethreads=79 runqueue=55 [25 11 3 19 30 9 50 24 14 13 3 54 32 2 6 26 14 8 35 18 26 12 46 19 14 65 17 24 30 54 5 19 21 13 54 55 11 10 43 48 45 38 47 54 25 61 56 11 24 0 0 30 46 15 0 0]
SCHED 152997ms: gomaxprocs=56 idleprocs=0 threads=140 spinningthreads=0 idlethreads=79 runqueue=54 [6 64 19 36 56 16 30 16 25 4 18 38 13 37 32 23 31 39 9 38 4 22 67 37 36 57 1 27 22 27 35 16 50 35 25 3 25 7 4 27 22 21 40 15 28 20 21 11 5 61 30 37 65 18 3 12]
SCHED 154004ms: gomaxprocs=56 idleprocs=0 threads=140 spinningthreads=0 idlethreads=79 runqueue=54 [3 25 20 36 68 41 20 8 0 30 0 36 46 61 0 34 21 27 28 3 20 37 19 16 3 27 3 53 22 57 21 16 15 32 47 30 10 20 19 27 23 17 23 31 10 54 12 32 11 28 17 16 19 0 33 20]
SCHED 155012ms: gomaxprocs=56 idleprocs=0 threads=140 spinningthreads=0 idlethreads=78 runqueue=51 [43 42 34 27 6 26 30 24 2 42 12 20 0 12 6 68 4 70 8 31 31 33 7 51 38 41 11 4 13 20 8 28 14 4 9 15 40 12 5 66 36 72 17 20 80 33 1 11 6 5 0 62 8 2 13 72]

pprof data

File: sched-test-linux-11
Type: cpu
Time: Oct 30, 2018 at 3:38pm (EDT)
Duration: 1mins, Total samples = 10.07mins (1004.00%)
Entering interactive mode (type "help" for commands, "o" for options)
(pprof) top20 -cum
Showing nodes accounting for 588.88s, 97.47% of 604.17s total
Dropped 74 nodes (cum <= 3.02s)
Showing top 20 nodes out of 24
      flat  flat%   sum%        cum   cum%
     0.79s  0.13%  0.13%    361.23s 59.79%  main.main.func2
   346.25s 57.31% 57.44%    346.25s 57.31%  runtime.futex
     3.40s  0.56% 58.00%    313.17s 51.83%  runtime.selectgo
    15.92s  2.64% 60.64%    202.97s 33.59%  runtime.lock
     0.82s  0.14% 60.77%    202.97s 33.59%  runtime.sellock
     3.87s  0.64% 61.41%    180.30s 29.84%  runtime.unlock
   167.55s 27.73% 89.15%    176.96s 29.29%  time.now
     0.07s 0.012% 89.16%    176.77s 29.26%  runtime.futexwakeup
     0.14s 0.023% 89.18%    169.69s 28.09%  runtime.futexsleep
     0.26s 0.043% 89.22%    103.53s 17.14%  runtime.selunlock
     0.45s 0.074% 89.30%     79.08s 13.09%  runtime.mcall
     0.12s  0.02% 89.32%     78.01s 12.91%  runtime.park_m
     0.16s 0.026% 89.35%     76.35s 12.64%  runtime.selparkcommit
    10.51s  1.74% 91.09%     46.47s  7.69%  main.workUntil
     8.85s  1.46% 92.55%     30.98s  5.13%  time.Now
    10.02s  1.66% 94.21%     10.02s  1.66%  runtime.procyield
     8.25s  1.37% 95.57%      8.25s  1.37%  runtime.osyield
     0.61s   0.1% 95.68%      7.46s  1.23%  runtime.timerproc
     5.59s  0.93% 96.60%      5.59s  0.93%  time.Time.Before
     5.25s  0.87% 97.47%      5.25s  0.87%  runtime.nanotime

I'm not sure why pprof reports the program was consuming 1000% CPU, but top reports it was using 5000% and a high amount of system CPU, as seen in this screen capture.

go111-mprocs56-gr2500

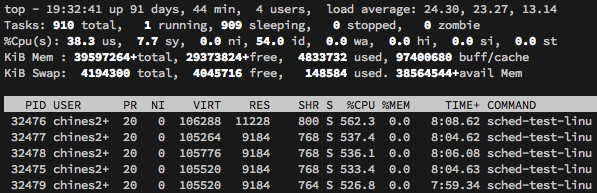
It seems clear to me that by the time the load has reached this level the scheduler has phase shifted from spinning on work stealing from empty queues to some other mode of operation where it is servicing deep local and global run queues and struggling to keep up even though we have the same total number of goroutines and tickers in the system.

So I did some bisecting on the goroutine count for the single process case just now and found that this phase shift takes place somewhere between 1000 and 1200 goroutines.

Go 1.11, GOMAXPROCS=56, 1 proc x 1200 goroutines

schedtrace sample

SCHED 63380ms: gomaxprocs=56 idleprocs=0 threads=142 spinningthreads=0 idlethreads=77 runqueue=48 [34 7 0 7 15 11 10 17 13 8 24 26 22 21 7 11 9 13 7 9 8 7 12 6 13 16 15 16 10 13 8 12 3 15 22 19 16 0 23 45 5 27 1 6 9 14 20 11 8 21 2 11 1 1 4 0]
SCHED 64387ms: gomaxprocs=56 idleprocs=0 threads=142 spinningthreads=0 idlethreads=76 runqueue=49 [21 6 15 4 10 19 21 7 0 5 11 13 20 0 9 8 1 4 0 9 3 23 18 15 13 23 6 0 2 34 14 45 0 4 5 19 0 37 14 7 8 10 0 14 3 5 5 7 12 16 5 8 24 16 0 20]
SCHED 65394ms: gomaxprocs=56 idleprocs=0 threads=142 spinningthreads=0 idlethreads=79 runqueue=52 [30 8 0 1 16 17 0 14 13 1 7 9 18 8 14 11 0 24 5 26 59 25 3 16 33 15 11 22 9 24 21 13 7 2 1 2 5 0 0 4 1 0 13 29 9 4 0 6 16 31 0 4 5 4 0 3]
SCHED 66401ms: gomaxprocs=56 idleprocs=0 threads=142 spinningthreads=0 idlethreads=76 runqueue=49 [3 8 23 12 10 23 8 12 7 3 21 1 6 13 9 4 0 15 0 8 31 4 8 4 21 2 23 3 40 2 14 7 49 2 13 12 6 6 33 16 8 0 1 0 21 3 21 38 16 26 0 7 17 0 1 20]
SCHED 67408ms: gomaxprocs=56 idleprocs=0 threads=142 spinningthreads=0 idlethreads=81 runqueue=54 [23 1 4 8 1 26 0 10 8 16 3 25 0 12 3 9 20 11 14 9 10 3 0 10 0 9 3 16 5 29 2 0 19 11 12 5 4 30 15 2 15 2 17 5 10 1 5 3 11 12 32 7 3 0 15 34]
SCHED 68415ms: gomaxprocs=56 idleprocs=0 threads=142 spinningthreads=0 idlethreads=78 runqueue=52 [8 17 25 27 13 4 3 26 0 3 29 17 0 3 12 2 16 16 6 9 12 11 1 0 25 0 21 11 13 10 2 6 7 8 37 12 0 15 0 3 5 9 4 16 15 3 32 0 5 0 15 0 19 25 1 6]

Go 1.11, GOMAXPROCS=56, 1 proc x 1100 goroutines

schedtrace sample

SCHED 81491ms: gomaxprocs=56 idleprocs=8 threads=141 spinningthreads=16 idlethreads=33 runqueue=0 [0 0 0 0 0 0 0 0 0 0 0 0 0 0 0 0 0 0 0 0 0 0 0 0 0 0 0 0 0 0 0 0 0 0 0 0 0 0 0 0 0 0 0 0 0 0 0 0 0 0 0 0 0 0 0 0]
SCHED 82497ms: gomaxprocs=56 idleprocs=0 threads=141 spinningthreads=0 idlethreads=32 runqueue=6 [3 2 0 0 0 0 0 1 0 2 0 0 0 1 0 0 0 0 0 0 0 0 0 1 0 0 0 0 0 0 0 0 0 0 0 0 0 0 0 0 0 0 0 0 0 0 0 0 0 0 0 0 0 0 0 0]
SCHED 83504ms: gomaxprocs=56 idleprocs=4 threads=141 spinningthreads=18 idlethreads=29 runqueue=0 [0 0 0 0 0 0 0 0 0 0 0 0 0 0 0 0 0 0 0 0 0 0 0 0 0 0 0 0 0 0 0 0 0 0 0 0 0 0 0 0 0 0 0 0 0 0 0 0 0 0 0 0 0 0 0 0]
SCHED 84510ms: gomaxprocs=56 idleprocs=0 threads=141 spinningthreads=0 idlethreads=25 runqueue=0 [0 0 0 0 0 0 0 0 0 0 0 0 0 0 0 0 0 0 0 0 0 0 0 0 0 0 0 0 0 0 0 0 0 0 0 0 0 0 0 0 0 0 0 0 0 0 0 0 0 0 0 0 0 0 0 0]
SCHED 85517ms: gomaxprocs=56 idleprocs=35 threads=141 spinningthreads=11 idlethreads=55 runqueue=0 [0 0 0 0 0 0 0 0 0 0 0 0 0 0 0 0 0 0 0 0 0 0 0 0 0 0 0 0 0 0 0 0 0 0 0 0 0 0 0 0 0 0 0 0 0 0 0 0 0 0 0 0 0 0 0 0]
SCHED 86523ms: gomaxprocs=56 idleprocs=14 threads=141 spinningthreads=15 idlethreads=39 runqueue=0 [0 0 0 0 0 0 0 0 0 0 0 0 0 0 0 0 0 0 0 0 0 0 0 0 0 0 0 0 0 0 0 0 0 0 0 0 0 0 0 0 0 0 0 0 0 0 0 0 0 0 0 0 0 0 0 0]

Go 1.11, GOMAXPROCS=56, 1 proc x 1000 goroutines

schedtrace sample

SCHED 75417ms: gomaxprocs=56 idleprocs=28 threads=138 spinningthreads=14 idlethreads=49 runqueue=0 [0 0 0 0 0 0 0 0 0 0 0 0 0 0 0 0 0 0 0 0 0 0 0 0 0 0 0 0 0 0 0 0 0 0 0 0 0 0 0 0 0 0 0 0 0 0 0 0 0 0 0 0 0 0 0 0]
SCHED 76423ms: gomaxprocs=56 idleprocs=29 threads=138 spinningthreads=13 idlethreads=42 runqueue=0 [0 0 0 0 0 0 0 0 0 0 0 0 0 0 0 0 0 0 0 0 0 0 0 0 0 0 0 0 0 0 0 0 0 0 0 0 0 0 0 0 0 0 0 0 0 0 0 0 0 0 0 0 0 0 0 0]
SCHED 77429ms: gomaxprocs=56 idleprocs=0 threads=138 spinningthreads=4 idlethreads=25 runqueue=2 [0 0 0 0 0 0 0 2 0 0 0 0 0 0 0 0 0 0 0 0 0 0 0 0 0 0 0 0 0 0 0 0 0 0 0 0 0 0 0 0 0 0 1 0 0 0 0 0 0 0 0 0 0 0 0 0]
SCHED 78435ms: gomaxprocs=56 idleprocs=0 threads=138 spinningthreads=4 idlethreads=24 runqueue=0 [0 0 0 0 0 0 0 0 0 0 0 0 0 0 0 0 0 0 0 0 0 0 0 0 0 0 0 0 0 0 0 6 0 0 0 0 0 0 0 0 0 0 0 0 0 0 0 0 0 0 0 0 0 0 0 0]
SCHED 79441ms: gomaxprocs=56 idleprocs=14 threads=138 spinningthreads=13 idlethreads=34 runqueue=0 [0 0 0 0 0 0 0 0 0 0 0 0 0 0 0 0 0 0 0 0 0 0 0 0 0 0 0 0 0 0 0 0 0 0 0 0 0 0 0 0 0 0 0 0 0 0 0 0 0 0 0 0 0 0 0 0]
SCHED 80447ms: gomaxprocs=56 idleprocs=0 threads=138 spinningthreads=3 idlethreads=24 runqueue=2 [0 2 0 0 0 0 0 0 0 0 0 0 0 0 0 0 0 0 0 0 0 0 0 0 0 0 0 0 0 0 0 0 0 0 0 0 0 0 0 0 0 0 0 0 0 0 0 0 0 0 0 0 0 0 0 0]

pprof data

File: sched-test-linux-11
Type: cpu
Time: Nov 15, 2018 at 10:50am (EST)
Duration: 1mins, Total samples = 9.71mins (968.36%)
Entering interactive mode (type "help" for commands, "o" for options)
(pprof) top20 -cum
Showing nodes accounting for 487.74s, 83.72% of 582.59s total
Dropped 72 nodes (cum <= 2.91s)
Showing top 20 nodes out of 47
      flat  flat%   sum%        cum   cum%
     1.03s  0.18%  0.18%    255.16s 43.80%  runtime.mcall
     0.15s 0.026%   0.2%    252.58s 43.35%  runtime.park_m
     0.52s 0.089%  0.29%    241.06s 41.38%  runtime.schedule
    22.30s  3.83%  4.12%    238.60s 40.96%  runtime.findrunnable
   196.50s 33.73% 37.85%    196.50s 33.73%  runtime.futex
   152.69s 26.21% 64.06%    159.76s 27.42%  time.now
    47.57s  8.17% 72.22%    136.66s 23.46%  runtime.lock
     0.16s 0.027% 72.25%    111.45s 19.13%  runtime.futexwakeup
     8.89s  1.53% 73.78%    110.23s 18.92%  runtime.unlock
     1.45s  0.25% 74.02%     93.82s 16.10%  main.main.func2
     1.50s  0.26% 74.28%     91.49s 15.70%  runtime.timerproc
     0.78s  0.13% 74.42%     86.01s 14.76%  runtime.futexsleep
     0.14s 0.024% 74.44%     78.51s 13.48%  runtime.notetsleepg
     0.18s 0.031% 74.47%     67.04s 11.51%  runtime.systemstack
     4.33s  0.74% 75.21%     51.25s  8.80%  runtime.selectgo
     0.90s  0.15% 75.37%     47.97s  8.23%  runtime.stopm
     8.61s  1.48% 76.85%     42.85s  7.36%  runtime.runqsteal
     8.78s  1.51% 78.35%     40.52s  6.96%  main.workUntil
    30.99s  5.32% 83.67%     34.24s  5.88%  runtime.runqgrab
     0.27s 0.046% 83.72%     32.86s  5.64%  runtime.entersyscallblock

Here is what top shows for this case.
go111-mprocs56-gr1000
Compare that with top for the Go 1.11, GOMAXPROCS=12, 5 procs x 500 goroutines case.
go111-mprocs12-gr500x5
Note that the single process case has less system idle time but is only servicing 2/5 the workload overall.

@agnivade
Copy link
Contributor

@aclements @mknyszek

nixprime added a commit to nixprime/go that referenced this issue Mar 24, 2020
Before this CL, the work-stealing loop in findrunnable() has the
following behavior:

- In the first 3 iterations, attempt to steal Gs from p.runq from other
Ps (i.e. Gs not at the head of other P's queues).

- In the final (4th) iteration, also attempt to steal from p.runnext
(i.e. Gs at the head of other P's queues), but only after sleeping for
3us before each stealing attempt.

Note that the number of loop iterations is arbitrary:
golang#16476 (comment)

This approach causes findrunnable() to scale poorly with GOMAXPROCS for
two reasons:

- The amount of time per iteration is linear in GOMAXPROCS.

- The amount of time spent sleeping in the last iteration is also linear
in GOMAXPROCS.

This CL changes the work-stealing loop to take at most 4us + 1 iteration
through all Ps, without any sleeping, by allowing the loop to spin iff
there is a p.runnext that will be, but is not yet, stealable. (The
amount of time to wait before stealing runnext is empirically bumped up
from 3us to 4us.)

Updates golang#28808
@gopherbot
Copy link

Change https://golang.org/cl/228577 mentions this issue: runtime: expand BenchmarkWakeupParallel tests

@gopherbot
Copy link

Change https://golang.org/cl/259578 mentions this issue: runtime: don't attempt to steal from idle Ps

@gopherbot
Copy link

Change https://golang.org/cl/264477 mentions this issue: runtime: try to elide timer stealing if P has no timers

gopherbot pushed a commit that referenced this issue Oct 23, 2020
Work stealing is a scalability bottleneck in the scheduler. Since each P
has a work queue, work stealing must look at every P to determine if
there is any work. The number of Ps scales linearly with GOMAXPROCS
(i.e., the number of Ps _is_ GOMAXPROCS), thus this work scales linearly
with GOMAXPROCS.

Work stealing is a later attempt by a P to find work before it goes
idle. Since the P has no work of its own, extra costs here tend not to
directly affect application-level benchmarks. Where they show up is
extra CPU usage by the process as a whole. These costs get particularly
expensive for applications that transition between blocked and running
frequently.

Long term, we need a more scalable approach in general, but for now we
can make a simple observation: idle Ps ([1]) cannot possibly have
anything in their runq, so we need not bother checking at all.

We track idle Ps via a new global bitmap, updated in pidleput/pidleget.
This is already a slow path (requires sched.lock), so we don't expect
high contention there.

Using a single bitmap avoids the need to touch every P to read p.status.
Currently, the bitmap approach is not significantly better than reading
p.status. However, in a future CL I'd like to apply a similiar
optimization to timers. Once done, findrunnable would not touch most Ps
at all (in mostly idle programs), which will avoid memory latency to
pull those Ps into cache.

When reading this bitmap, we are racing with Ps going in and out of
idle, so there are a few cases to consider:

1. _Prunning -> _Pidle: Running P goes idle after we check the bitmap.
In this case, we will try to steal (and find nothing) so there is no
harm.

2. _Pidle -> _Prunning while spinning: A P that starts running may queue
new work that we miss. This is OK: (a) that P cannot go back to sleep
without completing its work, and (b) more fundamentally, we will recheck
after we drop our P.

3. _Pidle -> _Prunning after spinning: After spinning, we really can
miss work from a newly woken P. (a) above still applies here as well,
but this is also the same delicate dance case described in findrunnable:
if nothing is spinning anymore, the other P will unpark a thread to run
the work it submits.

Benchmark results from WakeupParallel/syscall/pair/race/1ms (see
golang.org/cl/228577):

name                            old msec          new msec   delta
Perf-task-clock-8               250 ± 1%          247 ± 4%     ~     (p=0.690 n=5+5)
Perf-task-clock-16              258 ± 2%          259 ± 2%     ~     (p=0.841 n=5+5)
Perf-task-clock-32              284 ± 2%          270 ± 4%   -4.94%  (p=0.032 n=5+5)
Perf-task-clock-64              326 ± 3%          303 ± 2%   -6.92%  (p=0.008 n=5+5)
Perf-task-clock-128             407 ± 2%          363 ± 5%  -10.69%  (p=0.008 n=5+5)
Perf-task-clock-256             561 ± 1%          481 ± 1%  -14.20%  (p=0.016 n=4+5)
Perf-task-clock-512             840 ± 5%          683 ± 2%  -18.70%  (p=0.008 n=5+5)
Perf-task-clock-1024          1.38k ±14%        1.07k ± 2%  -21.85%  (p=0.008 n=5+5)

[1] "Idle Ps" here refers to _Pidle Ps in the sched.pidle list. In other
contexts, Ps may temporarily transition through _Pidle (e.g., in
handoffp); those Ps may have work.

Updates #28808
Updates #18237

Change-Id: Ieeb958bd72e7d8fb375b0b1f414e8d7378b14e29
Reviewed-on: https://go-review.googlesource.com/c/go/+/259578
Run-TryBot: Michael Pratt <mpratt@google.com>
TryBot-Result: Go Bot <gobot@golang.org>
Reviewed-by: Michael Knyszek <mknyszek@google.com>
Reviewed-by: Austin Clements <austin@google.com>
Trust: Michael Pratt <mpratt@google.com>
@gopherbot
Copy link

Change https://golang.org/cl/264697 mentions this issue: runtime: try to elide timer stealing if P has no timers

gopherbot pushed a commit that referenced this issue Oct 28, 2020
Following golang.org/cl/259578, findrunnable still must touch every
other P in checkTimers in order to look for timers to steal. This scales
poorly with GOMAXPROCS and potentially performs poorly by pulling remote
Ps into cache.

Add timerpMask, a bitmask that tracks whether each P may have any timers
on its timer heap.

Ideally we would update this field on any timer add / remove to always
keep it up to date. Unfortunately, updating a shared global structure is
antithetical to sharding timers by P, and doing so approximately doubles
the cost of addtimer / deltimer in microbenchmarks.

Instead we only (potentially) clear the mask when the P goes idle. This
covers the best case of avoiding looking at a P _at all_ when it is idle
and has no timers. See the comment on updateTimerPMask for more details
on the trade-off. Future CLs may be able to expand cases we can avoid
looking at the timers.

Note that the addition of idlepMask to p.init is a no-op. The zero value
of the mask is the correct init value so it is not necessary, but it is
included for clarity.

Benchmark results from WakeupParallel/syscall/pair/race/1ms (see
golang.org/cl/228577). Note that these are on top of golang.org/cl/259578:

name                        old msec           new msec   delta
Perf-task-clock-8           244 ± 4%           246 ± 4%     ~     (p=0.841 n=5+5)
Perf-task-clock-16          247 ±11%           252 ± 4%     ~     (p=1.000 n=5+5)
Perf-task-clock-32          270 ± 1%           268 ± 2%     ~     (p=0.548 n=5+5)
Perf-task-clock-64          302 ± 3%           296 ± 1%     ~     (p=0.222 n=5+5)
Perf-task-clock-128         358 ± 3%           352 ± 2%     ~     (p=0.310 n=5+5)
Perf-task-clock-256         483 ± 3%           458 ± 1%   -5.16%  (p=0.008 n=5+5)
Perf-task-clock-512         663 ± 1%           612 ± 4%   -7.61%  (p=0.008 n=5+5)
Perf-task-clock-1024      1.06k ± 1%         0.95k ± 2%  -10.24%  (p=0.008 n=5+5)

Updates #28808
Updates #18237

Change-Id: I4239cd89f21ad16dfbbef58d81981da48acd0605
Reviewed-on: https://go-review.googlesource.com/c/go/+/264477
Run-TryBot: Michael Pratt <mpratt@google.com>
TryBot-Result: Go Bot <gobot@golang.org>
Reviewed-by: Michael Knyszek <mknyszek@google.com>
Trust: Michael Pratt <mpratt@google.com>
@gopherbot
Copy link

Change https://golang.org/cl/266367 mentions this issue: runtime: elide timer re-check if P has no timers

gopherbot pushed a commit that referenced this issue Oct 30, 2020
In golang.org/cl/264477, I missed this new block after rebasing past
golang.org/cl/232298. These fields must be zero if there are no timers.

Updates #28808
Updates #18237

Change-Id: I2d9e1cbf326497c833daa26b11aed9a1e12c2270
Reviewed-on: https://go-review.googlesource.com/c/go/+/266367
Run-TryBot: Michael Pratt <mpratt@google.com>
Reviewed-by: Austin Clements <austin@google.com>
Reviewed-by: Ian Lance Taylor <iant@golang.org>
Reviewed-by: Michael Knyszek <mknyszek@google.com>
TryBot-Result: Go Bot <gobot@golang.org>
Trust: Michael Pratt <mpratt@google.com>
@gopherbot gopherbot added the compiler/runtime Issues related to the Go compiler and/or runtime. label Jul 7, 2022
@fly3366
Copy link

fly3366 commented Feb 16, 2023

Any plan for numa or split scheduler pool? Work stealing need support numa affinity.

@kscooo
Copy link

kscooo commented Oct 21, 2023

Any plan for numa or split scheduler pool? Work stealing need support numa affinity.

https://docs.google.com/document/d/1d3iI2QWURgDIsSR6G2275vMeQ_X7w-qxM2Vp7iGwwuM/pub

@mknyszek
Copy link
Contributor

To my knowledge, there's no work currently planned in this area. The document linked by @kscooo is from 2014 and the runtime has changed a bit since then, though it may still serve as a good starting point. However, as that document implies, it'll likely require a substantial restructuring of the runtime.

Sign up for free to join this conversation on GitHub. Already have an account? Sign in to comment
Labels
compiler/runtime Issues related to the Go compiler and/or runtime. NeedsInvestigation Someone must examine and confirm this is a valid issue and not a duplicate of an existing one. Performance
Projects
None yet
Development

No branches or pull requests

8 participants